Biostatistics and Research Methodology: From Study Design to Data Analysis
In case of research, there are two pillars that ascertain the credibility of your work which include biostatistics and research methodology. Biostatistics is the study of the collection and analysis of data in biology, medicine, and health of people. Research methodology is the roadmap that informs you of how you will collect data, the process that you shall employ, how you shall analyze and interpret data.
Biostatistics and Research Methodology principles assist you to go by a systematic road map to make your research meaningful, accurate, and effective. This blog will take you through the necessary procedures, starting with the knowledge of biostatistics, study design, data collection, analysis, and evidence-based decision-making.
Importance in modern research across disciplines
Contemporary research across disciplines relies on these fundamental principles. Ignoring them can lead to false assumptions, wasted resources, and poorly informed decisions particularly in applied fields such as health promotion.
Study design and data analysis are deeply interrelated: the structure of a study directly affects data validity, which in turn determines the suitability and accuracy of the statistical tools applied.
Understanding Biostatistics: The Backbone of Research
Biostatistics uses raw data to convert it into action. It allows researchers to summarize large datasets, to test hypotheses, and to draw an inference about population properties. Biostatistics in research points out that proper statistical knowledge is essential, otherwise, even well-compiled information may be interpreted in a false way.
Key Statistical Concepts
Mean, Median, Mode: Measures of central tendency which characterize the average observation.
1. Mean (Arithmetic Mean)
The mean is the most frequently used measure of central tendency — essentially the "average." It is the point of balance for your data.
Formula:
Mean=∑X/ N
Where:
2. Median
The median is the middle value when data are arranged in ascending or descending order. It’s the 50th percentile half the values are above it, half are below it.
Formulae
3. Mode
The mode is the number that occurs most often in a data set the "most popular" child in school.
Formula:
There’s no single arithmetic formula for ungrouped data; you simply identify the value that occurs most often.
Mode = L + ((fₘ - f₁) / (2fₘ - f₁ - f₂)) × h
Where:
-
L = Lower boundary of the modal class
-
fₘ = Frequency of the modal class
-
f₁ = Frequency of the class before the modal class
-
f₂ = Frequency of the class after the modal class
-
h = Class width
Types of Data
Quantitative:
Quantitative data represent measurable quantities, things you can count or measure. They answer “How much?” or “How many?”
They are expressed in numbers and can be analyzed statistically with means, medians, standard deviations, and correlations.
Numeric values, e.g., weight, blood pressure.
Qualitative:
Qualitative data describe qualities or characteristics things you can label, not measure.
They answer “What kind?” or “Which category?” and are used for classification rather than calculation.
Categories or labels, e.g., disease type, gender.
A solid grasp of these concepts ensures your data analysis is reliable and interpretable. Biostatistics and Research Methodology principles remind us that correct statistical application is the foundation of credible research.
Essentials of Research Methodology
Research methodology is the guide of all scientific expeditions, the framework of principles that directs the way research is planned, conducted, and interpreted. It offers a systematic, rational method of gathering, analyzing, and verifying data so that inferences made are dependable, repeatable, and informative.
Definition and scope of research methodology
-
Provides a structured framework guiding the research process, including techniques and tools for data collection and analysis.
-
Covers planning, designing, executing, and evaluating research to ensure reliable and meaningful results.
Difference between research methods and research methodology
-
Research methods are explicit tools or techniques such as surveys, experiments, and observations employed to collect data. and each research method is chosen based on the study’s objectives and the nature of the data.
-
Research methodology is the master plan and reason for selecting and utilizing these methods in a systematic approach.
Importance of a structured research approach
-
It establishes that the research is organized, consistent, valid and reliable, reducing the potential for error and allowing for scientific reproduction.
-
It promotes the credibility of research results and supports the researcher in efficiently deriving valid conclusions from data which can be implemented or taken action upon.
Formulating Research Questions and Hypotheses
A good research question determines the course of a study and must be clear, specific, measurable, and achievable. Without it, even the finest study design or statistical analysis could produce deceptive results.
Hypotheses are an extension of research questions and direct statistical testing:
Null hypothesis (H0): Implies that there is no effect or relationship between variables.
Alternative hypothesis (H1): Suggests that there is a true effect or relationship
Directional: Predicts the direction of the effect.
Non-directional: Predicts that there is an effect, but no direction is specified
Hypothesis testing assesses whether results seen are probably a result of chance, based on confidence intervals, p-values, and probabilities. A clear hypothesis at the beginning of the study conserves time, avoids misinterpretation, and maintains focus.
Takeaway: Well-defined hypotheses improve both study design and statistical rigor.
Study Designs in Research
Study design is a research blueprint that dictates the data collection, analysis, and interpretation. It influences validity and reliability directly. Designs are either observational or experimental:
Observational Studies: Researchers observe participants but do not intervene.
Cross-sectional: Point-in-time picture of a population; rapid and inexpensive, but unable to demonstrate causality.
Cohort: Traces a group over time; demonstrates temporal associations but expensive.
Case-control: Contrasts cases and controls; ideal for rare outcomes but vulnerable to bias.
Experimental Studies: The researchers intervene to evaluate cause-effect relationships.
Randomized Controlled Trials (RCTs): Gold standard; minimizes bias and confounding but expensive and sometimes less generalizable.
Strengths and limitations
Cross-sectional: Efficient and inexpensive; good for estimating prevalence but not to establish cause-and-effect relationships.
Cohort: Follows participants over a long period of time, showing patterns over time and risk factors, but requires a lot of time and resources.
Case-control: Effective for investigating rare outcomes and uses fewer participants, though susceptible to recall and selection bias.
Randomized Controlled Trials (RCTs): Reduce bias and allow strong causal inference but tend to be expensive and less applicable to real-life settings.
Sample Size Considerations
Sample size affects both the validity and statistical power of a study.
-
If the sample is too small, real effects may go undetected.
-
If it’s too large, resources are wasted without added benefit.
Principle: Proper effort invested in sampling leads to valid, reliable, and meaningful results.
Data Collection Methods
Primary vs secondary data collection
Primary data refers to data collected specifically for the purpose of the study
While secondary data refers to the data which the researcher uses following its previous collection (ex. report, database).
Surveys, questionnaires, experiments, and clinical trials
Common methods of collecting information that could involve self-reported responses, controlled testing, or observation taking place in the “real world” or in experimentally designed settings.
These methods help researchers gather reliable evidence to answer research questions and test hypotheses effectively.
Ensuring reliability and validity
Consistent procedures and accurate measurement techniques are used so that the data accurately represents what it is supposed to measure.
This strengthens the credibility of research findings and allows results to be replicated across different studies.
Data Management and Cleaning
Organizing data for analysis
Systematically structuring and organizing data for analysis while maintaining consistency, accuracy, and accessibility.
Handling missing data and outliers
Identifying and managing or imputing missing values, and identifying outliers in order to maintain data quality and the validity of the results.
Data coding and preparation for statistical software
Transforming raw data into correct formats so that codes can be assigned and datasets can be prepared so that they are ready for statistics software that will allow analysis to be conducted efficiently.
Statistical Analysis Techniques
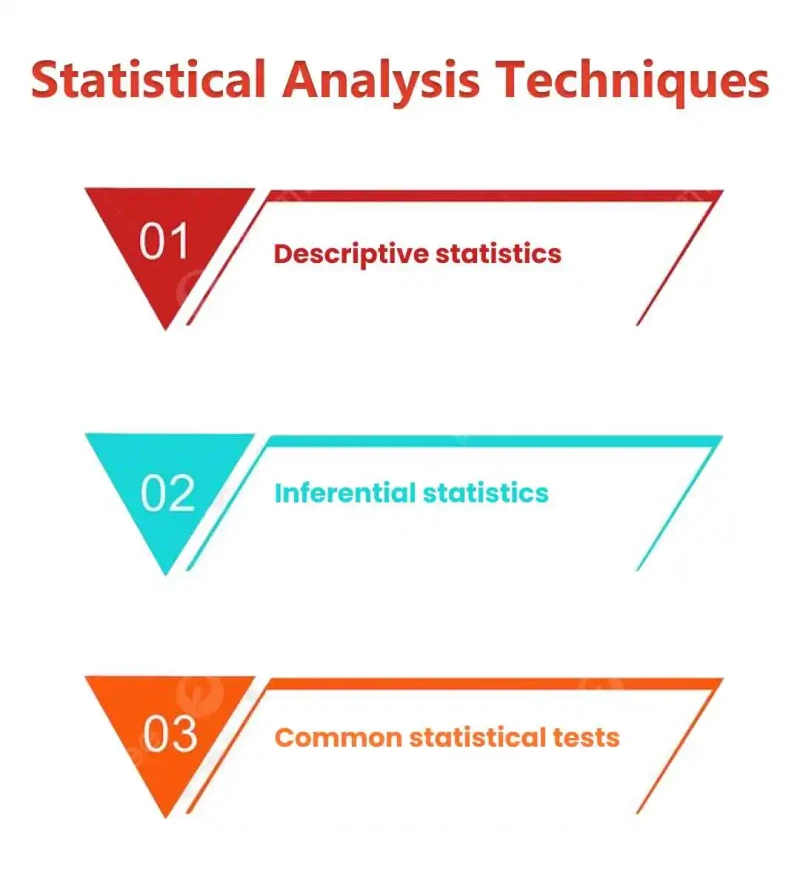
Descriptive statistics
Summarizing and representing data in order to comprehend patterns, trends, and salient features through measures such as mean, median, mode, and graphical representations like histograms and box plots.
Inferential statistics
Making inferences regarding a population from a sample by hypothesis testing, confidence intervals, and p-values, assisting in establishing relationships, significance, and predictions.
Common statistical tests
Data analysis using techniques such as t-test for two-group comparison, chi-square for the association between categorical data, ANOVA for comparisons across multiple groups, and regression analysis to develop and forecast variable relationships.
Interpreting and Reporting Results
Transforming statistical results into useful conclusions is crucial for effective research.
Translate outputs: Translate what numbers, p-values, and confidence intervals imply in context.
Avoid misinterpretation: P-values don't assess the probability that the null is true; confidence intervals indicate ranges that are likely, not definite.
Use visuals effectively: Tables, charts, and graphs make trends, comparisons, and relationships clear.
Pitfalls in Biostatistics and Research Methodology
-
Bias in study design or data collection: Inadequate planning or selective sampling distorts results and makes findings inaccurate.
-
Misuse or misinterpretation of statistical tests: Using the inappropriate test or misinterpreting results may result in incorrect conclusions.
-
Ethical lapses in data analysis or reporting: Altering, cherry-picking, or misrepresenting data compromises credibility.
An awareness of these pitfalls is necessary to preserve research integrity and ensure that your results are reliable and credible.
Integrating Biostatistics into Decision-Making
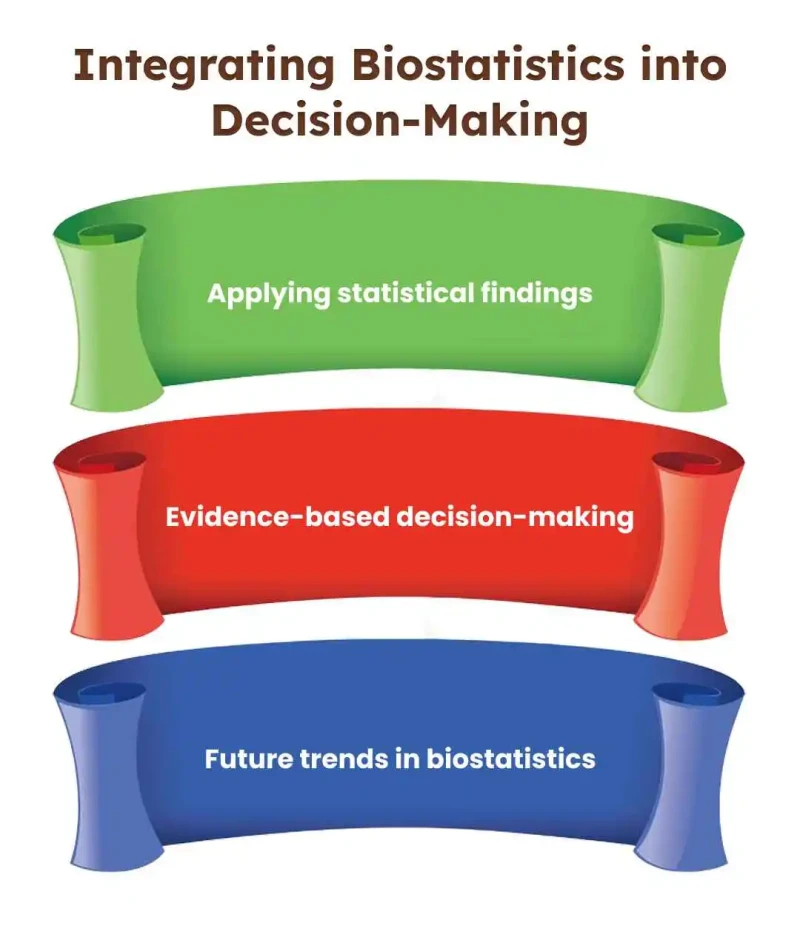
Biostatistics is not merely number crunching, it's translating data into decisions that make a difference. In clinical research, public health, or social sciences, statistical analysis closes the loop between research results and actual action.
Applying statistical findings
-
Biostatistics identifies patterns, quantifies risks, and assesses interventions. In clinical research, it informs treatment choices and drug development.
-
In public health, it informs disease prevention policies, vaccination policies, and health care planning. In social research, it informs trends in behavior and the impact on society.
Evidence-based decision-making
Statistical evidence provides authorities with assurance to make decisions based on strong data instead of conjecture. Statistical evidence ensures interventions are not only intuitive but also scientifically grounded, enhancing results, maximizing resources, and maximizing accountability.
Future trends in biostatistics
The future of biostatistics is big data, artificial intelligence (AI), and machine learning (ML). They allow analysis of gigantic, intricate datasets from genomics to social media revealing insights that were impossible to find before.
As these become more powerful, they will revolutionize the way researchers determine trends, forecast results, and tailor treatments.
End Note
Learning biostatistics and methodology is important since it involves formulating questions up to the interpretation of outputs. The Biostatistics and Research Methodology strategies remind us that credible research is based on rigorous methods and statistical thinking.
Hire professionals who can be employed in case of doubt regarding design or complicated analysis to prevent expensive mistakes and quality improvement. Use them honestly and your research will be credible, influential, and contributive in the field of study.


 By Emilia